Production Quality and Scrap
Track first-pass yield, scrap and rework. Compare the cost of poor quality across manufacturing batches.
Macro-free .xlsx · 20 sample records · Workbook labels in Turkish
Results from the sample workbook
- İlk seferde geçen
- 930
- İlk seferde verim
- 93%
- Hurda oranı
- 3%
Who can use it, and for what?
Production and quality teams
Track first-pass yield, scrap and rework by batch.
Operations and cost control
Prioritise quality losses by cost and choose the batches to investigate.
A worked example from the workbook
In PL-601, 30 of 1,000 items are scrapped and 40 are reworked. There are 930 first-pass units, for 93% yield, and quality losses cost 7,400. The workbook flags this batch for yield.
| Measure | Sample result |
|---|---|
| İlk seferde geçen | 930 |
| İlk seferde verim | 93% |
| Hurda oranı | 3% |
| Kalitesizlik maliyeti | 7,400 |
| Verim uyarısı | 1 |
| Adet kontrolü | 0 |
How do you start with your own data?
- Enter output, scrap and rework in the same unit. Do not count the same unit twice as a first-pass loss. Use separate scrap and rework unit costs.
- Make a copy of the sample workbook. Review the settings on Panel and replace the blue inputs on Veri with your own data.
- Compare dashboard totals with the row-level results on Veri. The written guide below shows how to test a change.
Detailed Excel guide
Initial setup
Enter output, scrap and rework in the same unit. Do not count the same unit twice as a first-pass loss. Use separate scrap and rework unit costs.
- Open a copy and try the sample data first. Panel contains settings and totals. Veri contains editable inputs and formulas. Workbook field labels are in Turkish and appear as written in the file.
- Compare the settings and the first data row below with the workbook. Blue cells are inputs. Preserve the working formulas.
- The workbook has 20 populated examples and 98 prepared formula rows. Keep the headers and replace the input values with your own records.
Panel settings
| Cell | Field | Sample value |
|---|---|---|
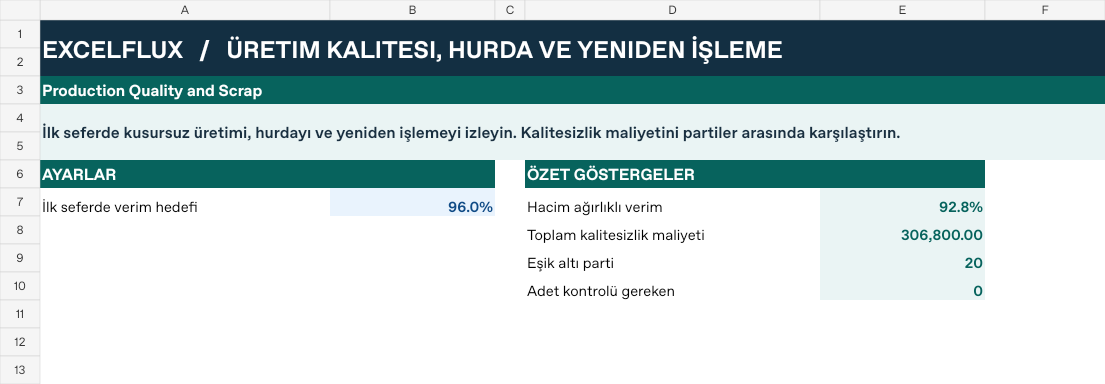
Panel!B7 | İlk seferde verim hedefi | 96% |
First data row
| Cell | Field | Sample value |
|---|---|---|
Veri!A7 | Parti | PL-601 |
Veri!B7 | Üretilen | 1,000 |
Veri!C7 | Hurda | 30 |
Veri!D7 | Yeniden işlenen | 40 |
Veri!E7 | Hurda maliyeti/adet | 140 |
Veri!F7 | Yeniden işleme/adet | 80 |
Calculated results and formulas
These values are calculated from the supplied workbook examples.
Formulas below use English Excel syntax. Function names and separators can vary with your Excel locale.
| Cell | Field | Sample value |
|---|---|---|
Veri!G7 | İlk seferde geçenCell formula=IF(A7="","",MAX(0,B7-C7-D7)) | 930 |
Veri!H7 | İlk seferde verimCell formula=IF(A7="","",IF(B7>0,G7/B7,0)) | 93% |
Veri!I7 | Hurda oranıCell formula=IF(A7="","",IF(B7>0,C7/B7,0)) | 3% |
Veri!J7 | Kalitesizlik maliyetiCell formula=IF(A7="","",C7*E7+D7*F7) | 7,400 |
Veri!K7 | Verim uyarısıCell formula=IF(A7="","",IF(AND(B7>0,H7<Panel!$B$7),1,0)) | 1 |
Veri!L7 | Adet kontrolüCell formula=IF(A7="","",IF(C7+D7>B7,1,0)) | 0 |
Dashboard indicators
These values are calculated from the supplied workbook examples.
| Cell | Field | Sample value |
|---|---|---|
Panel!E7 | Hacim ağırlıklı verim | 92.77% |
Panel!E8 | Toplam kalitesizlik maliyeti | 306,800 |
Panel!E9 | Eşik altı parti | 20 |
Panel!E10 | Adet kontrolü gereken | 0 |
Change one input and check the result
- Open the Veri sheet in the sample workbook.
C7→ enter 6.H7expected value 95.4%.- Review the affected dashboard metrics. Restore the test input or save the example as a separate copy before using your own data.
Interpretation and troubleshooting
First-pass yield excludes units later corrected by rework. Do not interpret the rate with zero volume. Review source counts if scrap plus rework exceeds production.
If the result does not change, confirm the input cell and sheet and check that automatic calculation is enabled. To reproduce the example, leave the remaining inputs at their starting values.