Budget and Year-End Forecast
Compare budget, actual spend, open commitments and remaining forecast by department.
Macro-free .xlsx · 16 sample records · Workbook labels in Turkish
Results from the sample workbook
- Baz yıl sonu
- 105,000
- Stres yıl sonu
- 106,520
- Bütçe farkı
- -6,520
Who can use it, and for what?
Department and budget owners
Review open purchase commitments alongside spending still planned for the year.
Finance and procurement
Discuss likely year-end overruns with departments before committing more spend.
A worked example from the workbook
For Logistics 1 the base forecast is 105,000 against a budget of 100,000. Under stress it rises to 106,520. The 6,520 overrun identifies a line to review before new spending is approved.
| Measure | Sample result |
|---|---|
| Baz yıl sonu | 105,000 |
| Stres yıl sonu | 106,520 |
| Bütçe farkı | -6,520 |
| Bütçe farkı % | -6.52% |
| Aşım tutarı | 6,520 |
| İzleme bayrağı | 1 |
How do you start with your own data?
- Align budget, actual spend and approved commitments to the same scope. Keep remaining forecast separate from open commitments. Move invoiced commitments to actuals.
- Make a copy of the sample workbook. Review the settings on Panel and replace the blue inputs on Veri with your own data.
- Compare dashboard totals with the row-level results on Veri. The written guide below shows how to test a change.
Detailed Excel guide
Initial setup
Align budget, actual spend and approved commitments to the same scope. Keep remaining forecast separate from open commitments. Move invoiced commitments to actuals.
- Open a copy and try the sample data first. Panel contains settings and totals. Veri contains editable inputs and formulas. Workbook field labels are in Turkish and appear as written in the file.
- Compare the settings and the first data row below with the workbook. Blue cells are inputs. Preserve the working formulas.
- The workbook has 16 populated examples and 98 prepared formula rows. Keep the headers and replace the input values with your own records.
Panel settings
| Cell | Field | Sample value |
|---|---|---|
Panel!B7 | Kalan tahmin artışı | 8% |
Panel!B8 | İzleme için aşım eşiği | 5% |
First data row
| Cell | Field | Sample value |
|---|---|---|
Veri!A7 | Faaliyet kalemi | Lojistik 1 |
Veri!B7 | Departman | Operasyon |
Veri!C7 | Bütçe | 100,000 |
Veri!D7 | Gerçekleşen | 65,000 |
Veri!E7 | Açık taahhüt | 21,000 |
Veri!F7 | Kalan tahmin | 19,000 |
Calculated results and formulas
These values are calculated from the supplied workbook examples.
Formulas below use English Excel syntax. Function names and separators can vary with your Excel locale.
| Cell | Field | Sample value |
|---|---|---|
Veri!G7 | Baz yıl sonuCell formula=IF(A7="","",SUM(D7:F7)) | 105,000 |
Veri!H7 | Stres yıl sonuCell formula=IF(A7="","",SUM(D7:E7)+F7*(1+Panel!$B$7)) | 106,520 |
Veri!I7 | Bütçe farkıCell formula=IF(A7="","",C7-H7) | -6,520 |
Veri!J7 | Bütçe farkı %Cell formula=IF(A7="","",IF(C7=0,0,I7/C7)) | -6.52% |
Veri!K7 | Aşım tutarıCell formula=IF(A7="","",MAX(0,-I7)) | 6,520 |
Veri!L7 | İzleme bayrağıCell formula=IF(A7="","",IF(AND(K7>0,K7>=C7*Panel!$B$8),1,0)) | 1 |
Dashboard indicators
These values are calculated from the supplied workbook examples.
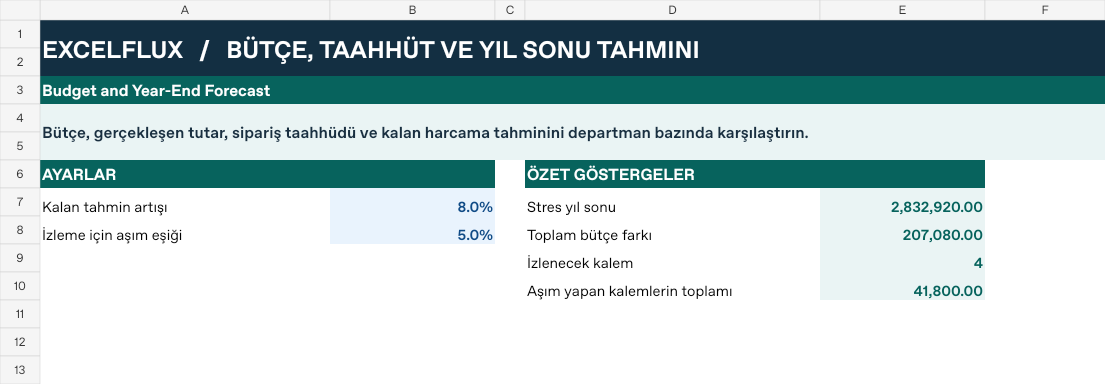
| Cell | Field | Sample value |
|---|---|---|
Panel!E7 | Stres yıl sonu | 2,832,920 |
Panel!E8 | Toplam bütçe farkı | 207,080 |
Panel!E9 | İzlenecek kalem | 4 |
Panel!E10 | Aşım yapan kalemlerin toplamı | 41,800 |
Change one input and check the result
- Open the Veri sheet in the sample workbook.
F7→ enter 0.I7expected value 14,000.- Review the affected dashboard metrics. Restore the test input or save the example as a separate copy before using your own data.
Interpretation and troubleshooting
The stress factor applies to the uncommitted forecast. Duplicate costs inflate exposure. Check the variance label before deciding whether a positive amount is favorable.
If the result does not change, confirm the input cell and sheet and check that automatic calculation is enabled. To reproduce the example, leave the remaining inputs at their starting values.