Sales Pipeline Forecast
Weight opportunity value by close probability. Review target gap, downside exposure and high-confidence deals.
Macro-free .xlsx · 18 sample records · Workbook labels in Turkish
Results from the sample workbook
- Ağırlıklı gelir
- 30,000
- Kötümser gelir
- 21,600
- Yüksek olasılıklı brüt
- 0
Who can use it, and for what?
B2B sales managers
Weight opportunities by their chance of closing and compare the forecast with the period target.
Agencies and service firms
Review how delayed proposals affect expected revenue and future workload.
A worked example from the workbook
OP-201 is worth 120,000 with a 25% chance of closing. Its contribution to the base forecast is 30,000 and its downside contribution is 21,600. Use those figures when assessing how the deal affects the period forecast.
| Measure | Sample result |
|---|---|
| Ağırlıklı gelir | 30,000 |
| Kötümser gelir | 21,600 |
| Yüksek olasılıklı brüt | 0 |
| Dönem dışı tutar | 0 |
How do you start with your own data?
- Enter each opportunity once, with a realistic close date and win probability. Define the period cutoff and high-probability threshold on Panel.
- Make a copy of the sample workbook. Review the settings on Panel and replace the blue inputs on Veri with your own data.
- Compare dashboard totals with the row-level results on Veri. The written guide below shows how to test a change.
Detailed Excel guide
Initial setup
Enter each opportunity once, with a realistic close date and win probability. Define the period cutoff and high-probability threshold on Panel.
- Open a copy and try the sample data first. Panel contains settings and totals. Veri contains editable inputs and formulas. Workbook field labels are in Turkish and appear as written in the file.
- Compare the settings and the first data row below with the workbook. Blue cells are inputs. Preserve the working formulas.
- The workbook has 18 populated examples and 98 prepared formula rows. Keep the headers and replace the input values with your own records.
Panel settings
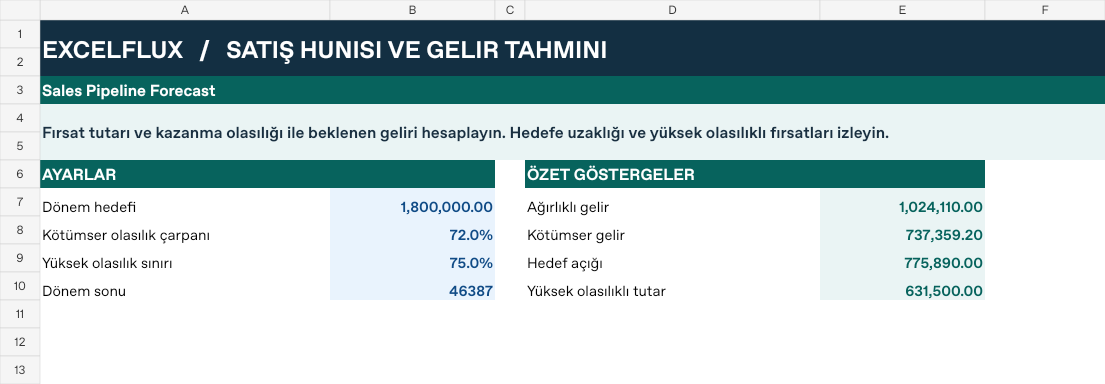
| Cell | Field | Sample value |
|---|---|---|
Panel!B7 | Dönem hedefi | 1,800,000 |
Panel!B8 | Kötümser olasılık çarpanı | 72% |
Panel!B9 | Yüksek olasılık sınırı | 75% |
Panel!B10 | Dönem sonu | 2026-12-31 |
First data row
| Cell | Field | Sample value |
|---|---|---|
Veri!A7 | Fırsat | OP-201 |
Veri!B7 | Müşteri | Ada |
Veri!C7 | Aşama | Keşif |
Veri!D7 | Potansiyel tutar | 120,000 |
Veri!E7 | Kazanma olasılığı | 25% |
Veri!F7 | Kapanış tarihi | 2026-11-22 |
Calculated results and formulas
These values are calculated from the supplied workbook examples.
Formulas below use English Excel syntax. Function names and separators can vary with your Excel locale.
| Cell | Field | Sample value |
|---|---|---|
Veri!G7 | Ağırlıklı gelirCell formula=IF(A7="","",IF(F7<=Panel!$B$10,D7*E7,0)) | 30,000 |
Veri!H7 | Kötümser gelirCell formula=IF(A7="","",G7*Panel!$B$8) | 21,600 |
Veri!I7 | Yüksek olasılıklı brütCell formula=IF(A7="","",IF(AND(F7<=Panel!$B$10,E7>=Panel!$B$9),D7,0)) | 0 |
Veri!J7 | Dönem dışı tutarCell formula=IF(A7="","",IF(F7>Panel!$B$10,D7,0)) | 0 |
Dashboard indicators
These values are calculated from the supplied workbook examples.
| Cell | Field | Sample value |
|---|---|---|
Panel!E7 | Ağırlıklı gelir | 1,024,110 |
Panel!E8 | Kötümser gelir | 737,359.2 |
Panel!E9 | Hedef açığı | 775,890 |
Panel!E10 | Yüksek olasılıklı tutar | 631,500 |
Change one input and check the result
- Open the Veri sheet in the sample workbook.
E7→ enter 80%.I7expected value 120,000.- Review the affected dashboard metrics. Restore the test input or save the example as a separate copy before using your own data.
Interpretation and troubleshooting
Weighted revenue is an expected value. High-probability gross value is nominal contract value above the threshold. Do not add them together. Recheck deals that move beyond the cutoff.
If the result does not change, confirm the input cell and sheet and check that automatic calculation is enabled. To reproduce the example, leave the remaining inputs at their starting values.