Shift Cost and Coverage
Record overnight shifts, breaks and staffing demand. Identify uncovered labor hours and estimated labor costs.
Macro-free .xlsx · 21 sample records · Workbook labels in Turkish
Results from the sample workbook
- Net vardiya (saat)
- 7.5
- Planlı kişi-saat
- 30
- Açık kişi-saat
- 15
Who can use it, and for what?
Shift and site supervisors
Use uncovered person-hours to decide which shifts need more people.
Manufacturing, security and logistics
Review overnight work, breaks and other costs with the labour budget.
A worked example from the workbook
The 22:00–06:00 shift has 7.5 net hours after a 30-minute break. The example has 15 uncovered person-hours, 66.67% coverage and a total cost of 7,965 including extras. Use the figures when planning cover.
| Measure | Sample result |
|---|---|
| Net vardiya (saat) | 7.5 |
| Planlı kişi-saat | 30 |
| Açık kişi-saat | 15 |
| Ücret tahmini | 6,750 |
| Ek giderli maliyet | 7,965 |
| Kapsama oranı | 66.67% |
How do you start with your own data?
- Enter shifts as Excel times and breaks in minutes. An overnight shift may finish at an earlier clock time than it started. Use headcount and hourly cost for the same shift.
- Make a copy of the sample workbook. Review the settings on Panel and replace the blue inputs on Veri with your own data.
- Compare dashboard totals with the row-level results on Veri. The written guide below shows how to test a change.
Detailed Excel guide
Initial setup
Enter shifts as Excel times and breaks in minutes. An overnight shift may finish at an earlier clock time than it started. Use headcount and hourly cost for the same shift.
- Open a copy and try the sample data first. Panel contains settings and totals. Veri contains editable inputs and formulas. Workbook field labels are in Turkish and appear as written in the file.
- Compare the settings and the first data row below with the workbook. Blue cells are inputs. Preserve the working formulas.
- The workbook has 21 populated examples and 98 prepared formula rows. Keep the headers and replace the input values with your own records.
Panel settings
| Cell | Field | Sample value |
|---|---|---|
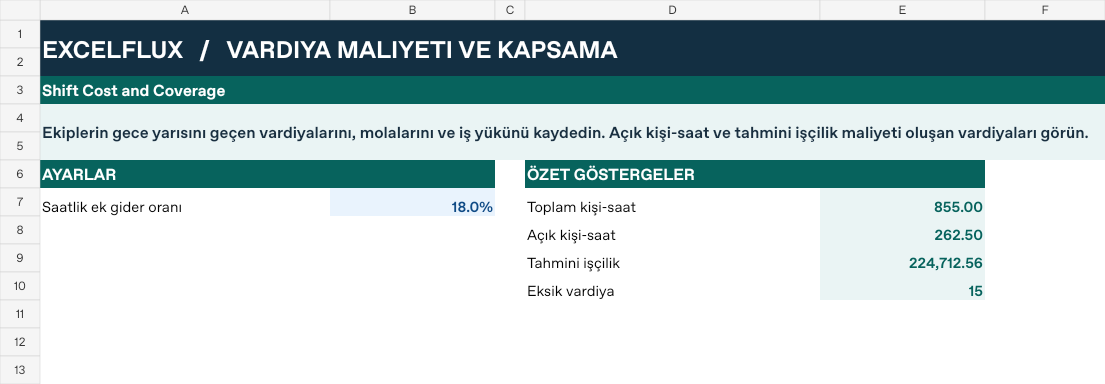
Panel!B7 | Saatlik ek gider oranı | 18% |
First data row
| Cell | Field | Sample value |
|---|---|---|
Veri!A7 | Vardiya | Hafta 01 / Gece |
Veri!B7 | Başlangıç | 22:00 |
Veri!C7 | Bitiş | 06:00 |
Veri!D7 | Mola (dk) | 30 |
Veri!E7 | Planlı kişi | 4 |
Veri!F7 | Gereken kişi | 6 |
Veri!G7 | Saat ücreti | 180 |
Veri!H7 | Ücret çarpanı | 1.25 |
Calculated results and formulas
These values are calculated from the supplied workbook examples.
Formulas below use English Excel syntax. Function names and separators can vary with your Excel locale.
| Cell | Field | Sample value |
|---|---|---|
Veri!I7 | Net vardiya (saat)Cell formula=IF(A7="","",MAX(0,MOD(C7-B7,1)*24-D7/60)) | 7.5 |
Veri!J7 | Planlı kişi-saatCell formula=IF(A7="","",I7*E7) | 30 |
Veri!K7 | Açık kişi-saatCell formula=IF(A7="","",MAX(0,F7-E7)*I7) | 15 |
Veri!L7 | Ücret tahminiCell formula=IF(A7="","",J7*G7*H7) | 6,750 |
Veri!M7 | Ek giderli maliyetCell formula=IF(A7="","",L7*(1+Panel!$B$7)) | 7,965 |
Veri!N7 | Kapsama oranıCell formula=IF(A7="","",IF(F7>0,MIN(1,E7/F7),1)) | 66.67% |
Dashboard indicators
These values are calculated from the supplied workbook examples.
| Cell | Field | Sample value |
|---|---|---|
Panel!E7 | Toplam kişi-saat | 855 |
Panel!E8 | Açık kişi-saat | 262.5 |
Panel!E9 | Tahmini işçilik | 224,712.56 |
Panel!E10 | Eksik vardiya | 15 |
Change one input and check the result
- Open the Veri sheet in the sample workbook.
E7→ enter 6.K7expected value 0.- Review the affected dashboard metrics. Restore the test input or save the example as a separate copy before using your own data.
Interpretation and troubleshooting
Net hours, person-hours and cost are different measures. Zero staffing shortage does not mean zero labor cost. Review breaks longer than the shift.
If the result does not change, confirm the input cell and sheet and check that automatic calculation is enabled. To reproduce the example, leave the remaining inputs at their starting values.