E-Commerce Unit Economics
Combine discounts, returns, commissions, logistics and advertising. Review unit contribution and the advertising break-even ceiling.
Macro-free .xlsx · 18 sample records · Workbook labels in Turkish
Results from the sample workbook
- Net ciro
- 41,400
- Toplam değişken maliyet
- 27,756
- Katkı kârı
- 5,644
Who can use it, and for what?
Marketplace and online sellers
See which products contribute after returns and commissions.
Advertising and category teams
Compare campaign spend with the maximum advertising cost a product can absorb.
A worked example from the workbook
UR-110 shows 41,400 in net revenue and 5,644 in contribution. Up to 13,644 in advertising costs can be covered by this example before contribution reaches zero. Compare that limit with actual campaign spend.
| Measure | Sample result |
|---|---|
| Net ciro | 41,400 |
| Toplam değişken maliyet | 27,756 |
| Katkı kârı | 5,644 |
| Katkı % | 13.63% |
| Azami reklam bütçesi | 13,644 |
| Sipariş başına katkı | 56.44 |
How do you start with your own data?
- Use consistent tax treatment and the same period for product cost, shipping, returns and ads. Review the shared cost per return and marketplace fee.
- Make a copy of the sample workbook. Review the settings on Panel and replace the blue inputs on Veri with your own data.
- Compare dashboard totals with the row-level results on Veri. The written guide below shows how to test a change.
Detailed Excel guide
Initial setup
Use consistent tax treatment and the same period for product cost, shipping, returns and ads. Review the shared cost per return and marketplace fee.
- Open a copy and try the sample data first. Panel contains settings and totals. Veri contains editable inputs and formulas. Workbook field labels are in Turkish and appear as written in the file.
- Compare the settings and the first data row below with the workbook. Blue cells are inputs. Preserve the working formulas.
- The workbook has 18 populated examples and 98 prepared formula rows. Keep the headers and replace the input values with your own records.
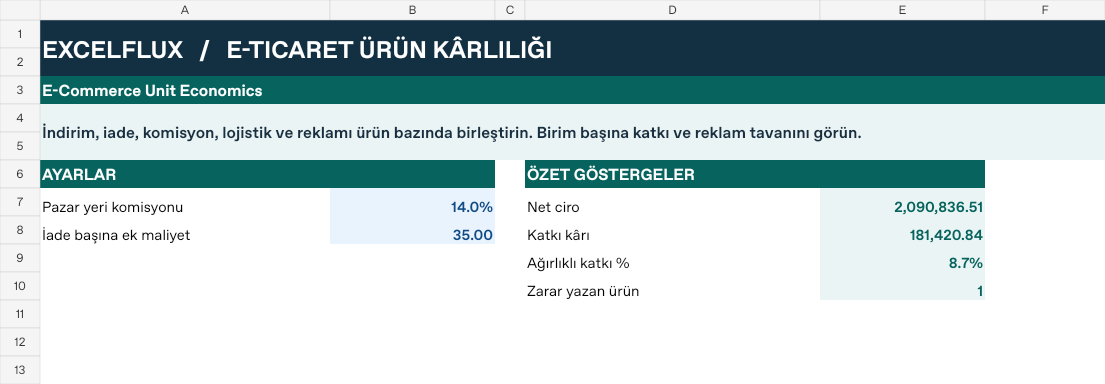
Panel settings
| Cell | Field | Sample value |
|---|---|---|
Panel!B7 | Pazar yeri komisyonu | 14% |
Panel!B8 | İade başına ek maliyet | 35 |
First data row
| Cell | Field | Sample value |
|---|---|---|
Veri!A7 | Ürün | UR-110 |
Veri!B7 | Adet | 100 |
Veri!C7 | Liste fiyatı | 500 |
Veri!D7 | İndirim | 10% |
Veri!E7 | İade oranı | 8% |
Veri!F7 | Ürün maliyeti | 190 |
Veri!G7 | Kargo/adet | 42 |
Veri!H7 | Reklam | 8,000 |
Calculated results and formulas
These values are calculated from the supplied workbook examples.
Formulas below use English Excel syntax. Function names and separators can vary with your Excel locale.
| Cell | Field | Sample value |
|---|---|---|
Veri!I7 | Net ciroCell formula=IF(A7="","",B7*C7*(1-D7)*(1-E7)) | 41,400 |
Veri!J7 | Toplam değişken maliyetCell formula=IF(A7="","",I7*Panel!$B$7+B7*((1-E7)*F7+G7+E7*Panel!$B$8)) | 27,756 |
Veri!K7 | Katkı kârıCell formula=IF(A7="","",I7-J7-H7) | 5,644 |
Veri!L7 | Katkı %Cell formula=IF(A7="","",IF(I7>0,K7/I7,0)) | 13.63% |
Veri!M7 | Azami reklam bütçesiCell formula=IF(A7="","",MAX(0,I7-J7)) | 13,644 |
Veri!N7 | Sipariş başına katkıCell formula=IF(A7="","",IF(B7>0,K7/B7,0)) | 56.44 |
Dashboard indicators
These values are calculated from the supplied workbook examples.
| Cell | Field | Sample value |
|---|---|---|
Panel!E7 | Net ciro | 2,090,836.51 |
Panel!E8 | Katkı kârı | 181,420.84 |
Panel!E9 | Ağırlıklı katkı % | 8.68% |
Panel!E10 | Zarar yazan ürün | 1 |
Change one input and check the result
- Open the Veri sheet in the sample workbook.
H7→ enter 14,000.K7expected value -356.- Review the affected dashboard metrics. Restore the test input or save the example as a separate copy before using your own data.
Interpretation and troubleshooting
Contribution is measured before company overhead. Compare actual advertising with the break-even ad allowance. Negative contribution indicates the modeled sales do not cover direct costs.
If the result does not change, confirm the input cell and sheet and check that automatic calculation is enabled. To reproduce the example, leave the remaining inputs at their starting values.