E-Commerce Channel Profitability and Returns
See contribution and operating result by channel after returns, commissions, logistics and advertising.
Premium workbook preview · Member downloads are not yet available
Results from the sample workbook
- Net sales
- 273,840
- Contribution
- 75,600
- Operating result
- 49,600
Who can use it, and for what?
Marketplace sellers and channel managers
Compare sales channels that have different commission and advertising cost structures.
A worked example from the workbook
K-001 has 273,840 in net sales and 75,600 of contribution. After fixed channel costs, the operating result is 49,600. The distinction helps when planning channel growth.
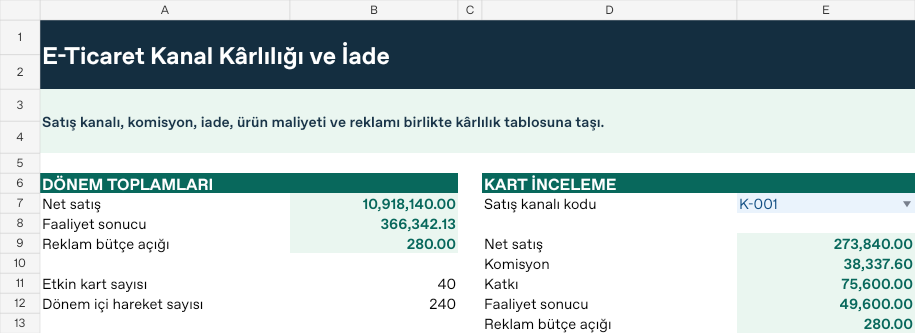
| Measure | Sample result |
|---|---|
| Net sales | 273,840 |
| Contribution | 75,600 |
| Operating result | 49,600 |
How do you start with your own data?
- Set commission, fixed cost, margin target and ad budget by channel.
- Post gross sales, returns and discounts, product and logistics costs, and advertising spend.
- Set the report start, end and scenario on Ayarlar. Both boundary dates are included.
- Review per-record calculations on Analiz and totals and selected cards such as K-001 on Panel. Resolve unmatched codes, missing dates and duplicate records on Kontrol.
Test a different scenario
Raise the advertising multiplier in Ayarlar B9 from 1.08 to 1.20. K-001’s net sales stay at 273,840, while operating result falls from 49,600 to 45,366.40. Its actual advertising budget gap stays at 280. Keep K-001 selected on Panel and compare the result. Restore the original input when you finish.
Hücre adresleri ve formüller için Türkçe kılavuzu aç