Maintenance Reliability and Downtime Cost
Track availability, time between failures and maintenance budget gaps by asset.
Premium workbook preview · Member downloads are not yet available
Results from the sample workbook
- Availability
- 56.32%
- Mean repair time (hours)
- 2.6
- Budget gap
- 517,796
Who can use it, and for what?
Maintenance engineering, facilities and field operations
Investigate how low availability affects downtime cost and budget at the asset level.
A worked example from the workbook
K-001 shows 56.32% availability and a mean repair time of 2.6 hours. Under the sample assumptions, 517,796 of the estimated 572,796 cost is over budget.
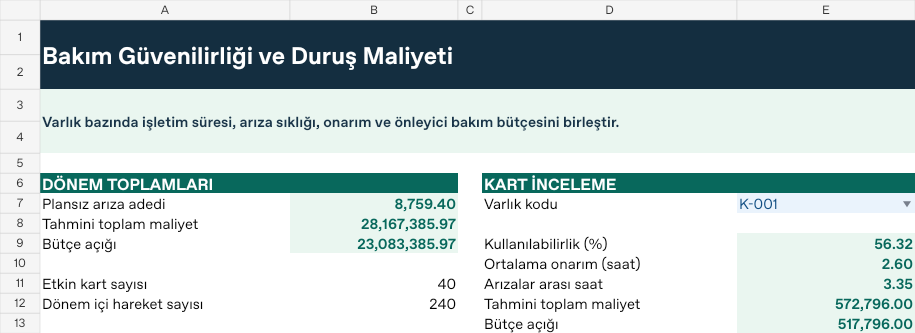
| Measure | Sample result |
|---|---|
| Availability | 56.32% |
| Mean repair time (hours) | 2.6 |
| Budget gap | 517,796 |
How do you start with your own data?
- Set scheduled operating hours, downtime rate, budget and target availability on the asset record.
- Post failure counts, unplanned repair hours and planned and unplanned costs by date.
- Set the report start, end and scenario on Ayarlar. Both boundary dates are included.
- Review per-record calculations on Analiz and totals and selected cards such as K-001 on Panel. Resolve unmatched codes, missing dates and duplicate records on Kontrol.
Test a different scenario
Lower Ayarlar B9 from 1.15 to 1.00. K-001’s availability stays the same, while estimated total cost drops from 572,796 to 504,000 and its budget gap falls to 449,000. Keep K-001 selected on Panel and compare the result. Restore the original input when you finish.
Hücre adresleri ve formüller için Türkçe kılavuzu aç