Work Centre Loading and Bottlenecks
Compare operating, setup and downtime hours with normal and overtime capacity by work centre.
Premium workbook preview · Member downloads are not yet available
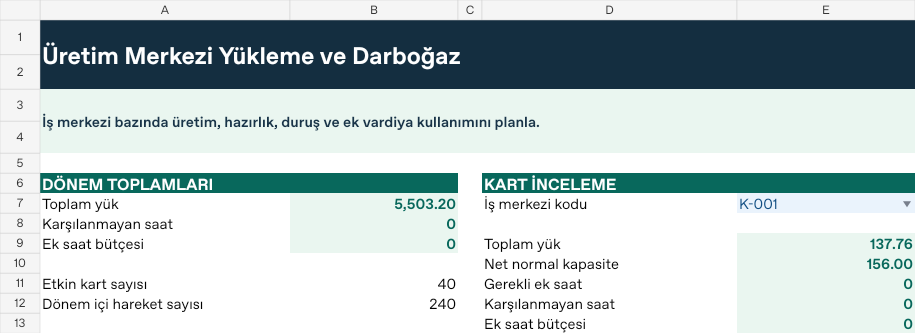
Results from the sample workbook
- Total load (hours)
- 137.76
- Net normal capacity (hours)
- 156
- Uncovered hours
- 0
Who can use it, and for what?
Production planning, workshops and contract manufacturing
See which centres can absorb new work and when load may need to move.
A worked example from the workbook
K-001 has a load of 137.76 hours against 156 hours of net normal capacity. This period requires no extra hours and shows no uncovered hours.
| Measure | Sample result |
|---|---|
| Total load (hours) | 137.76 |
| Net normal capacity (hours) | 156 |
| Uncovered hours | 0 |
How do you start with your own data?
- Define normal hours, overtime limit, hourly cost and downtime reserve by centre.
- Log process, setup, downtime and outsourced hours by date and centre code.
- Set the report start, end and scenario on Ayarlar. Both boundary dates are included.
- Review per-record calculations on Analiz and totals and selected cards such as K-001 on Panel. Resolve unmatched codes, missing dates and duplicate records on Kontrol.
Test a different scenario
Reduce normal hours in Kartlar B7 from 164 to 130. K-001’s net capacity drops to 122 hours. Load remains 137.76 hours, so 15.76 overtime hours cost 10,244. Keep K-001 selected on Panel and compare the result. Restore the original input when you finish.
Hücre adresleri ve formüller için Türkçe kılavuzu aç